NASA Space Explorer App NASA 太空探索平台
About
Why I built this
NASA publishes a remarkable amount of data every day — the Astronomy Picture of the Day, full-disk Earth photographs taken hourly, real-time tracking of asteroids near our planet. All of it is freely available through a public API.
The problem is that raw API data is just JSON. Numbers, coordinates, timestamps. It takes real effort to see what it actually means.
I wanted to build something that removed that friction — where a curious person, not a researcher, could open a browser and understand what’s happening in space today.
What it does
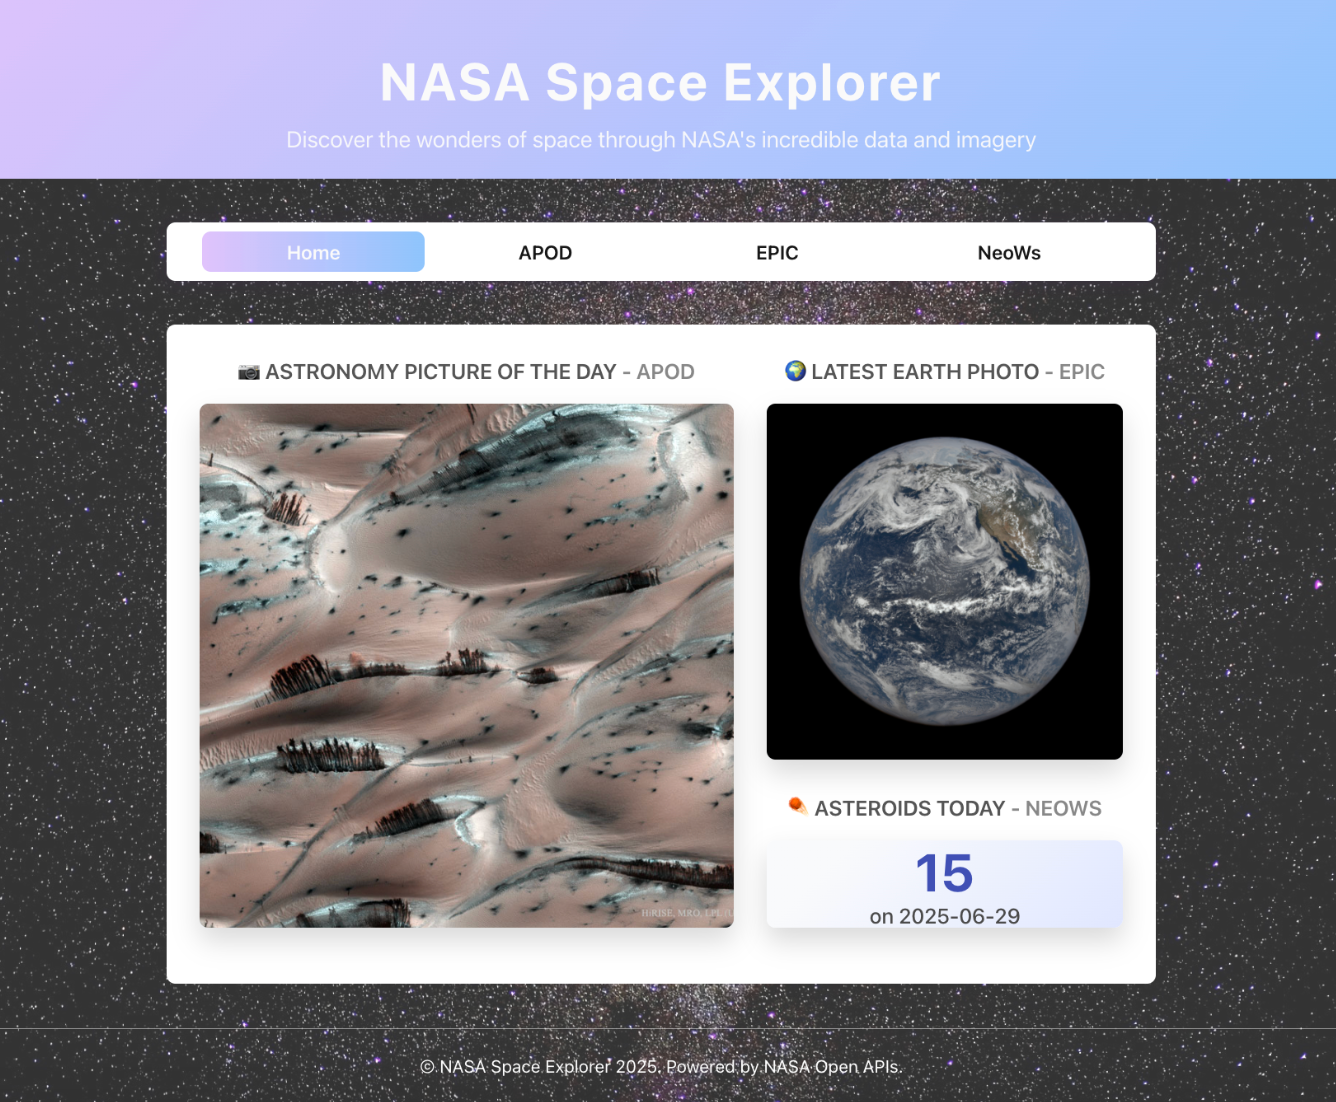
The app pulls from three NASA data streams:
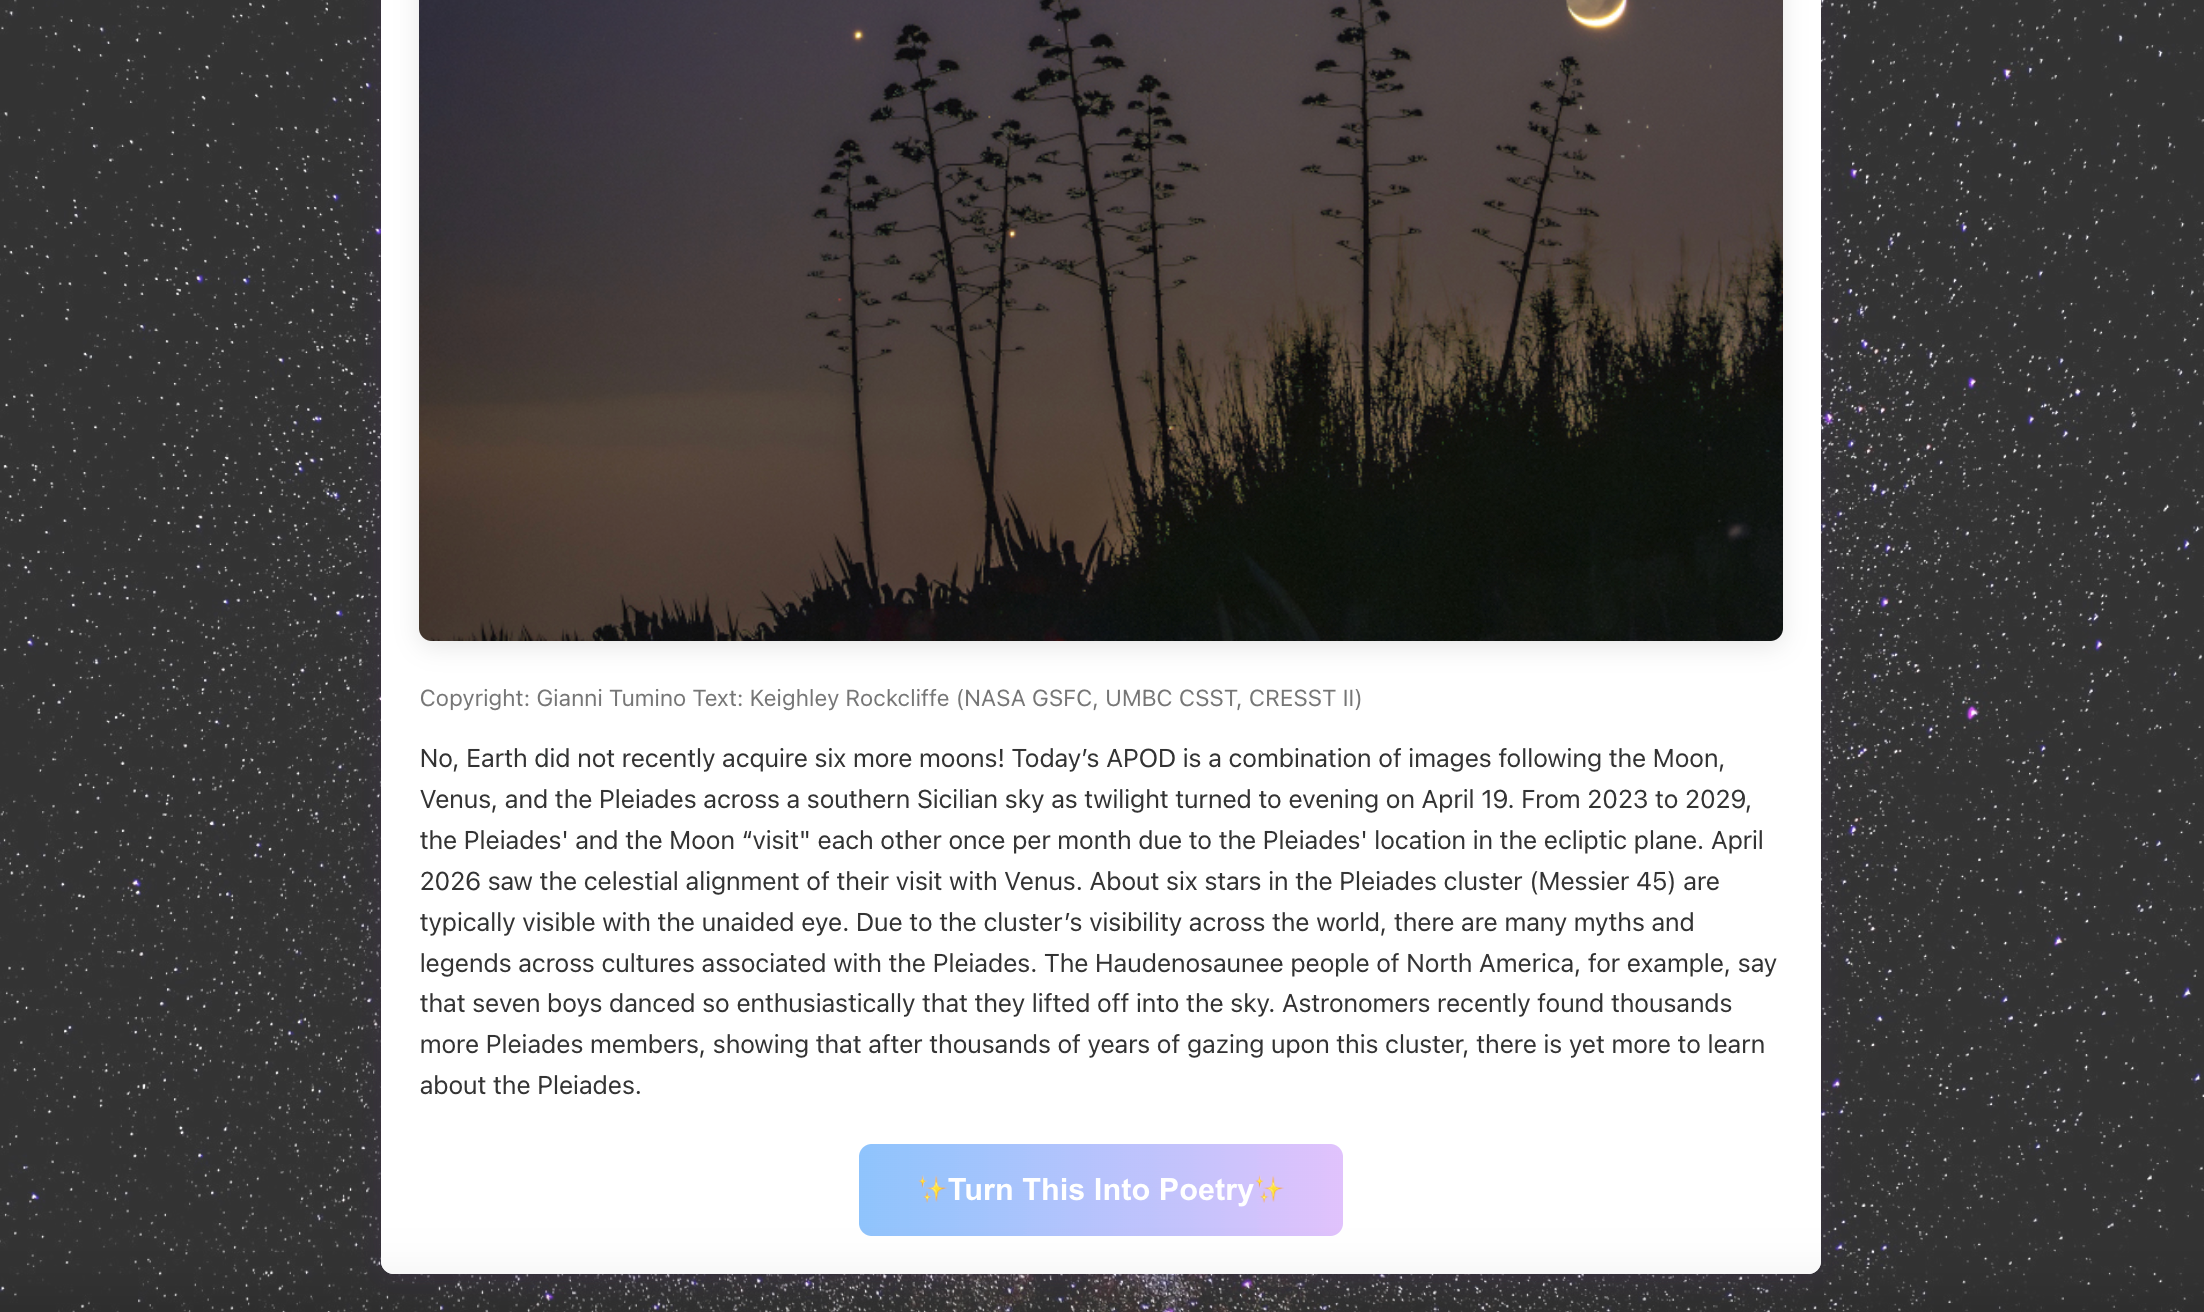
Astronomy Picture of the Day (APOD) — each day’s featured image with its original NASA caption. I added a Gemini AI layer that generates a short, social-ready description of the image — the kind of thing you might actually want to share.
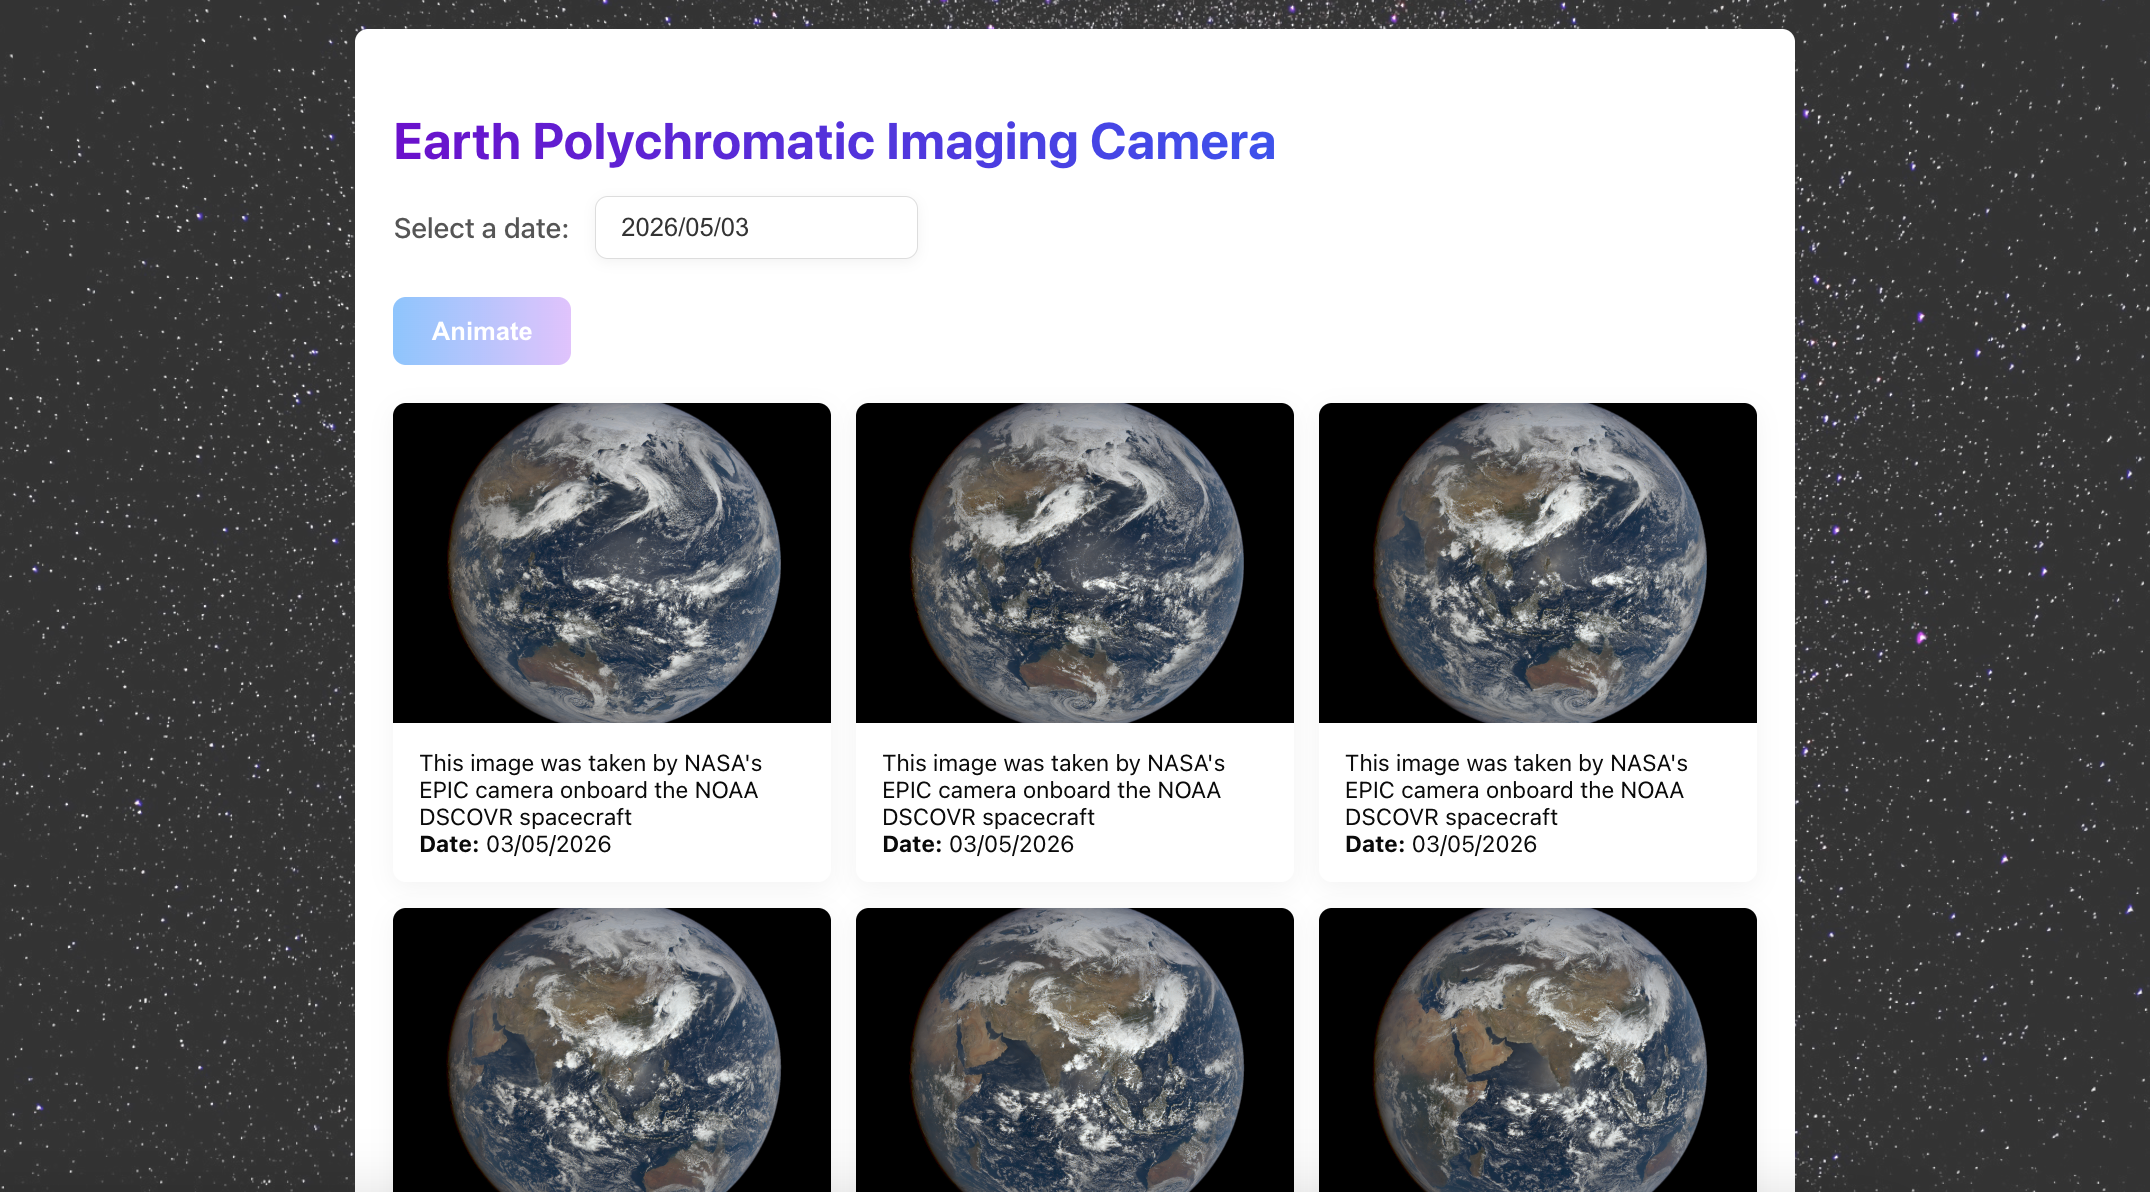
Earth Polychromatic Imaging Camera (EPIC) — the DSCOVR satellite photographs the full Earth in color every hour. Pick any date, and the app assembles those images into a short animation. It’s a simple idea, but watching the planet rotate is quietly striking.
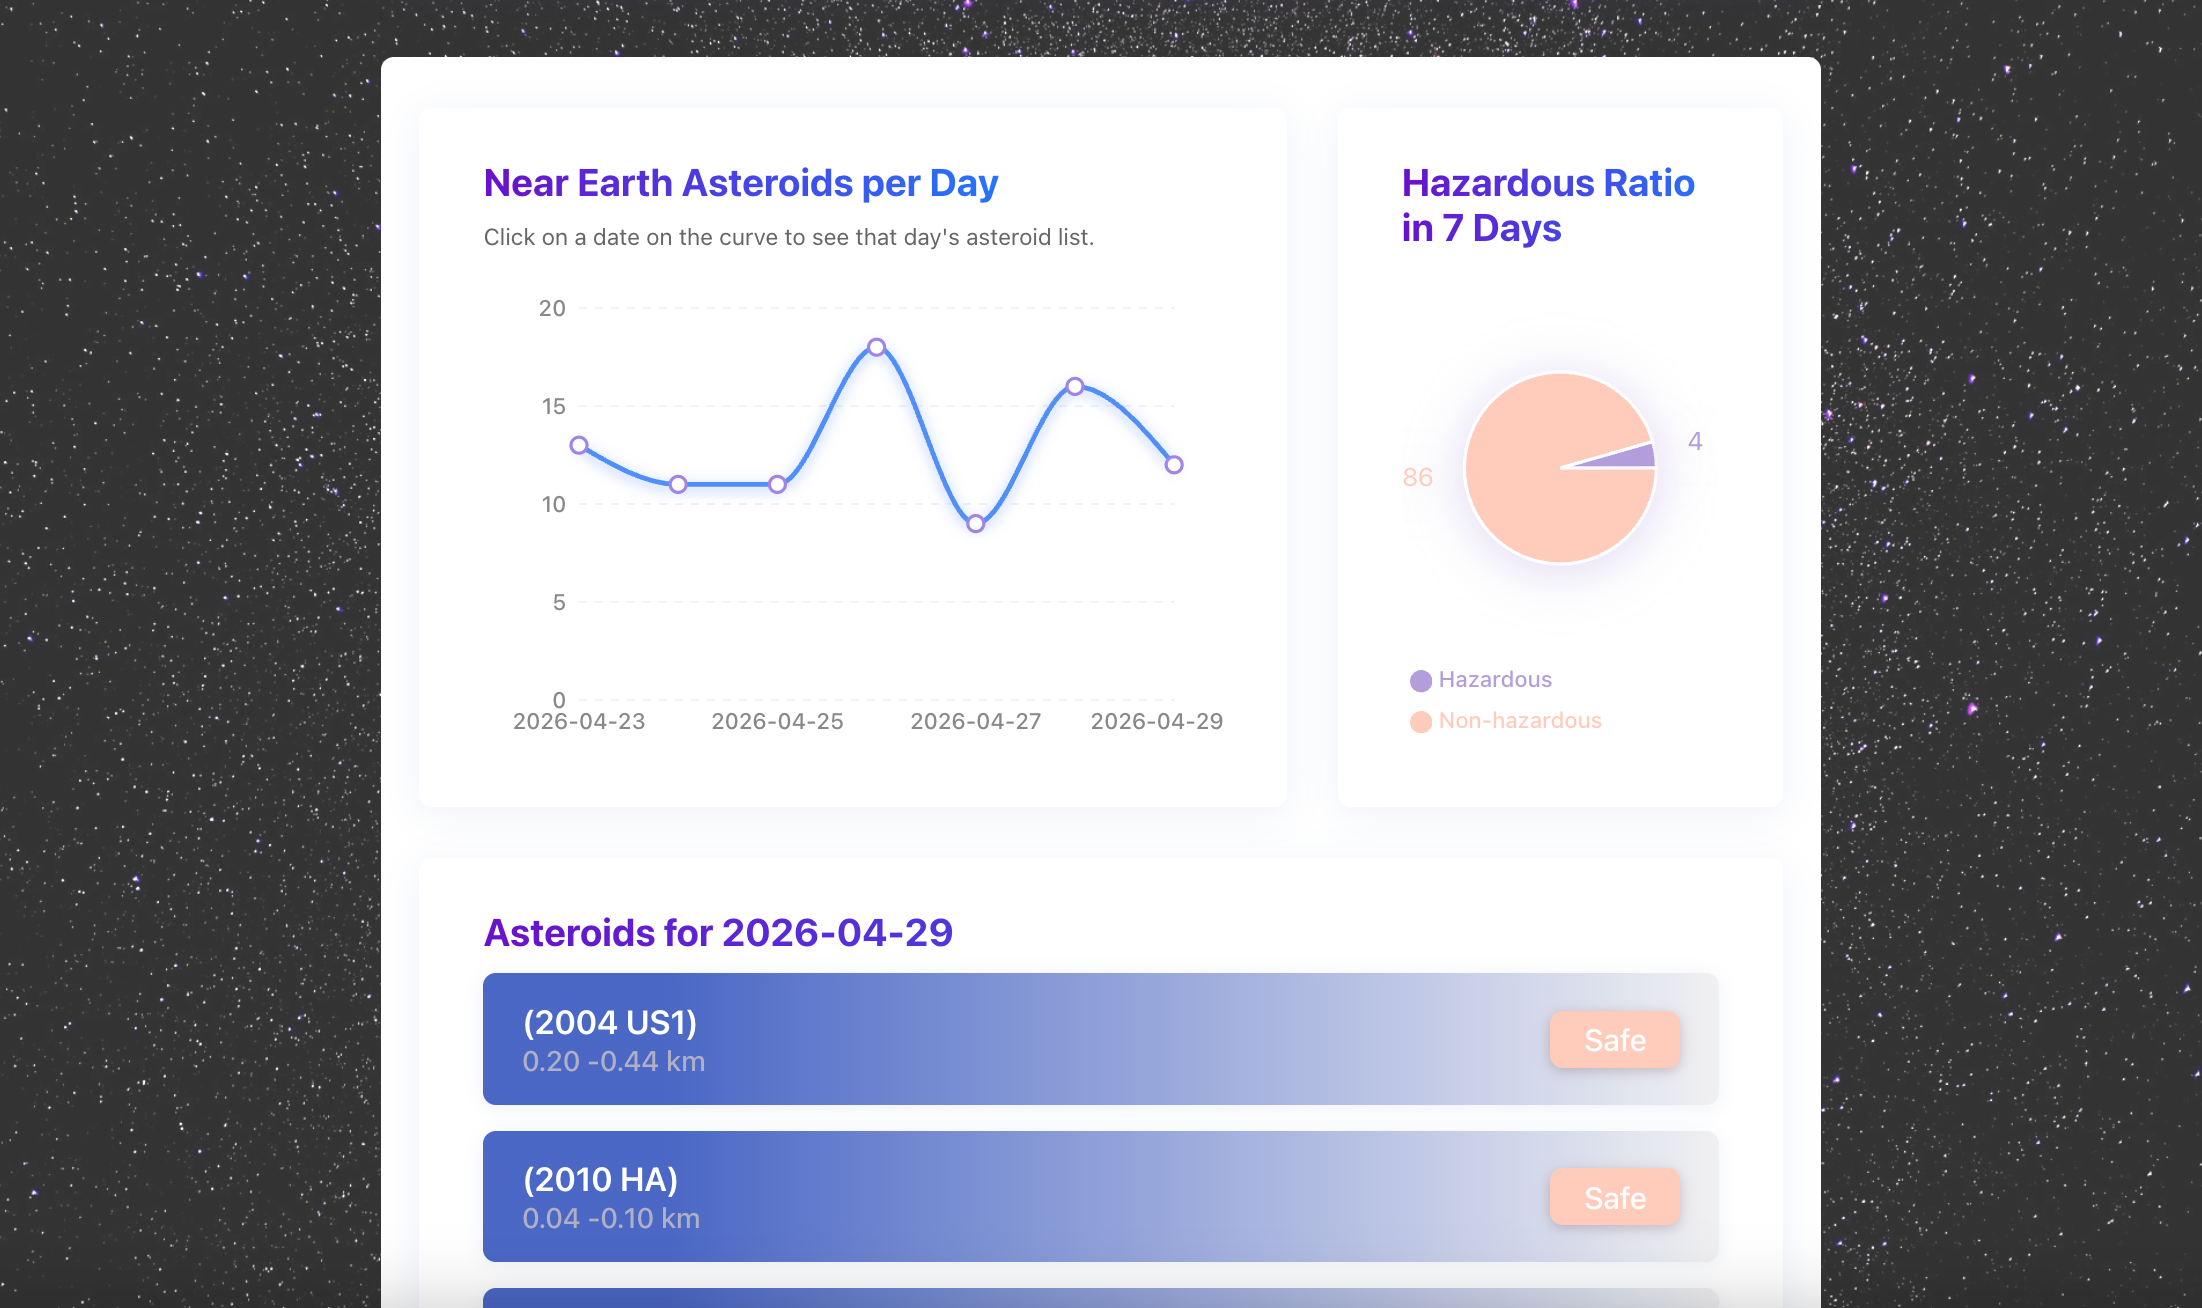
Near Earth Object Web Service (NeoWs) — on any given day, dozens of asteroids pass close to Earth. The app shows their count over time as a line chart, flags potentially hazardous ones, and lets you click into individual objects for detail. The data sounds alarming; visualised properly, it’s reassuring.
A few things I cared about
Making complexity disappear. High-resolution space images are large. I preloaded all EPIC frames before playback begins — so the animation runs smoothly rather than stuttering mid-loop. Meanwhile, images outside the viewport stay unloaded until you scroll to them, keeping the initial load fast. Each section also has its own loading state, keeping the interface responsive while data fetches in the background.
Staying honest when something breaks. NASA’s APIs occasionally go dark, or return partial data. Rather than crashing or showing nothing, the app isolates each data source independently — if NeoWs data is unavailable, the APOD and EPIC sections keep working. I wanted it to feel stable, not fragile.
The AI piece. Integrating Gemini wasn’t about automation for its own sake. The idea was that a short, human-sounding caption might be the thing that makes someone pause on an image they’d otherwise scroll past. Whether it works is for the reader to judge.
Stack
React · Node.js / Express · Recharts · Gemini AI · NASA Open APIs
This page focuses on the product and design thinking behind the app. For implementation details — API integration, project structure, and setup — see the GitHub repo.
Reflection
One thing worth reflecting on: for a period of time after this app went live, NASA’s EPIC API went down, taking the entire section with it. I’d put real effort into that module — the image gallery, the date picker, the frame-by-frame animation of the Earth rotating. The code was all there. The data wasn’t.
The API has since recovered, and everything is back online. But the experience taught me something about the real cost of depending on external APIs: you don’t control them. No matter how solid your own code is, one upstream outage is all it takes to leave users staring at a blank screen.
Going forward, I want to explore other space-related data sources and find new ways to render that same sense of scale — the Earth from above, objects drifting through the dark — without tying the experience to a single point of failure.
概述
出发点
NASA 每天发布大量数据——每日天文图片、卫星每小时拍摄的地球全貌、实时的近地小行星追踪记录。这些数据全部通过公开 API 免费提供。
问题在于,原始 API 数据只是 JSON。数字、坐标、时间戳——没有上下文,看不出意义。
我想做一个能消除这层隔阂的东西——让一个好奇的普通人,而不是研究者,打开浏览器就能感受到今天宇宙里发生了什么。
实现
应用接入了三个 NASA 数据源:
每日天文图片(APOD) — 每天一张精选太空图像,附原始 NASA 说明。我在此基础上加了一个 Gemini AI 层,为图片生成简短的、适合社交媒体分享的文字描述。
地球多光谱成像(EPIC) — DSCOVR 卫星每小时拍摄一张完整的地球彩色图像。选择任意日期,应用将这些图像合成为一段短动画——看着地球静静自转,有一种难以言说的感觉。
近地天体网络服务(NeoWs) — 每天都有数十颗小行星从地球附近飞过。应用以折线图展示数量变化,标记潜在危险天体,并支持点击查看单个天体的详细信息。数据听起来令人不安,可视化之后,反而令人踏实。
几个关键点
让复杂消失: 太空图像文件很大。我在 EPIC 动画播放前预加载了所有图像帧,确保播放流畅不卡顿。同时,视口外的图像会保持未加载状态,直到滚动到对应位置,从而保证初始加载速度。每个数据模块也有独立的加载状态,让界面在数据请求期间保持可响应。
诚实地处理故障: NASA 的 API 偶尔会出错或返回不完整的数据。我没有选择让整个页面崩溃,而是让每个数据源独立运行——NeoWs 数据不可用时,APOD 和 EPIC 依然正常工作。这是一个刻意的架构决策,不是事后补救。
关于 AI: 接入 Gemini 不是为了自动化而自动化。我的设想是:一段听起来像人说的话,或许能让人在本来会划走的图片前停下来。这个判断留给读者。
技术栈
React · Node.js / Express · Recharts · Gemini AI · NASA API
此处侧重介绍项目本身的思路,技术实现细节(API 集成、项目结构、本地运行)请参阅 GitHub 仓库。
复盘
值得思考的一点是,在之前的某一段时间里,由于 NASA 的 EPIC API 服务突然不可用,这个应用关于EPIC的部分全都无法访问了。我在这个模块上花了不少时间:图片gallery、日期选择器、地球逐帧旋转的动画效果… 功能本身是完整的,但获取不到原始数据。
现在 API 恢复了,相关部分也重新上线了。但这次经历让我深刻体会到依赖外部 API 的代价——你无法掌控它。无论你的代码多么稳定,上游的一次故障都可能导致页面一片空白。
往后我想探索更多宇宙相关的数据源,找到新的方式来呈现那种尺度感——从太空俯瞰地球,物体在黑暗中漂移——而不是把整个体验押注在单一数据源上。